graph LR
    %% Data Sources and Storage
    BGG[BoardGameGeek API] -->|Data Collection| GCS[(Google Cloud Storage)]
    GCS -->|Data Loading| PrepData[Preprocessed Games Data]

    %% Data Splitting
    PrepData -->|Time-based Split| DataSets[Training/Validation/Testing Sets]

    %% Main Model Components
    DataSets -->|Training| Models[Model Training]

    %% Model Types
    Models --> HurdleModel[Hurdle Model<br>Classification]
    Models --> WeightModel[Complexity Model<br>Regression]
    Models --> RatingModels[Rating Models<br>Regression]

    %% Evaluation and Deployment
    HurdleModel --> Evaluation[Model Evaluation]
    WeightModel --> Evaluation
    RatingModels --> Evaluation

    Evaluation --> Tracking[Performance Tracking]
    Evaluation --> Deployment[Model Deployment]

    %% Styling
    classDef storage fill:#f9f,stroke:#333,stroke-width:2px;
    classDef model fill:#bbf,stroke:#333,stroke-width:1px;
    classDef data fill:#dfd,stroke:#333,stroke-width:1px;

    class GCS,VetiverModels storage;
    class HurdleModel,WeightModel,RatingModels,Models model;
    class PrepData,DataSets,NewGames,Predictions data;
Methodology
1 About
The goal of this project was to train models to predict new and upcoming releases once information about them becomes available on BoardGameGeek. How do you train a model to predict new releases?
I use historical data from BoardGameGeek (BGG) to train a number of predictive models for community ratings. I train a series of models for this purpose.
- I first classify games based on their probability of achieving a minimum number of ratings on BGG.
- I then estimate each game’s complexity (average weight) in order to predicts its number of user ratings and average rating.
- I then use these estimates to predict the expected Geek Rating.
1.1 Methodology
I develop and train models using a training-validation approach based around the year in which games were published. I create a training set of games published prior to 2022 and evaluated its performance in predicting games published from 2022 to 2023.
1.2 Data
Show the code
# data
# raw pull from bgg
tar_load(games_raw)
# split for train/valid/test
tar_load(split)

# get training set
train_data =
    split |>
    training()

# get validation set
valid_data =
    split |>
    validation()

# full data
full_data =
    bind_rows(train_data, valid_data)
2 Data
As of my most recent data job, there are 129616 individual games on BGG. For each of these games, I have information about the game (playing time, mechanisms, components, publishers, artists, designers, etc), as well as information voted on by the BGG community (average rating, average weight).
Show the code
full_data |>
    sample_n(1000) |>
    visdat::vis_dat()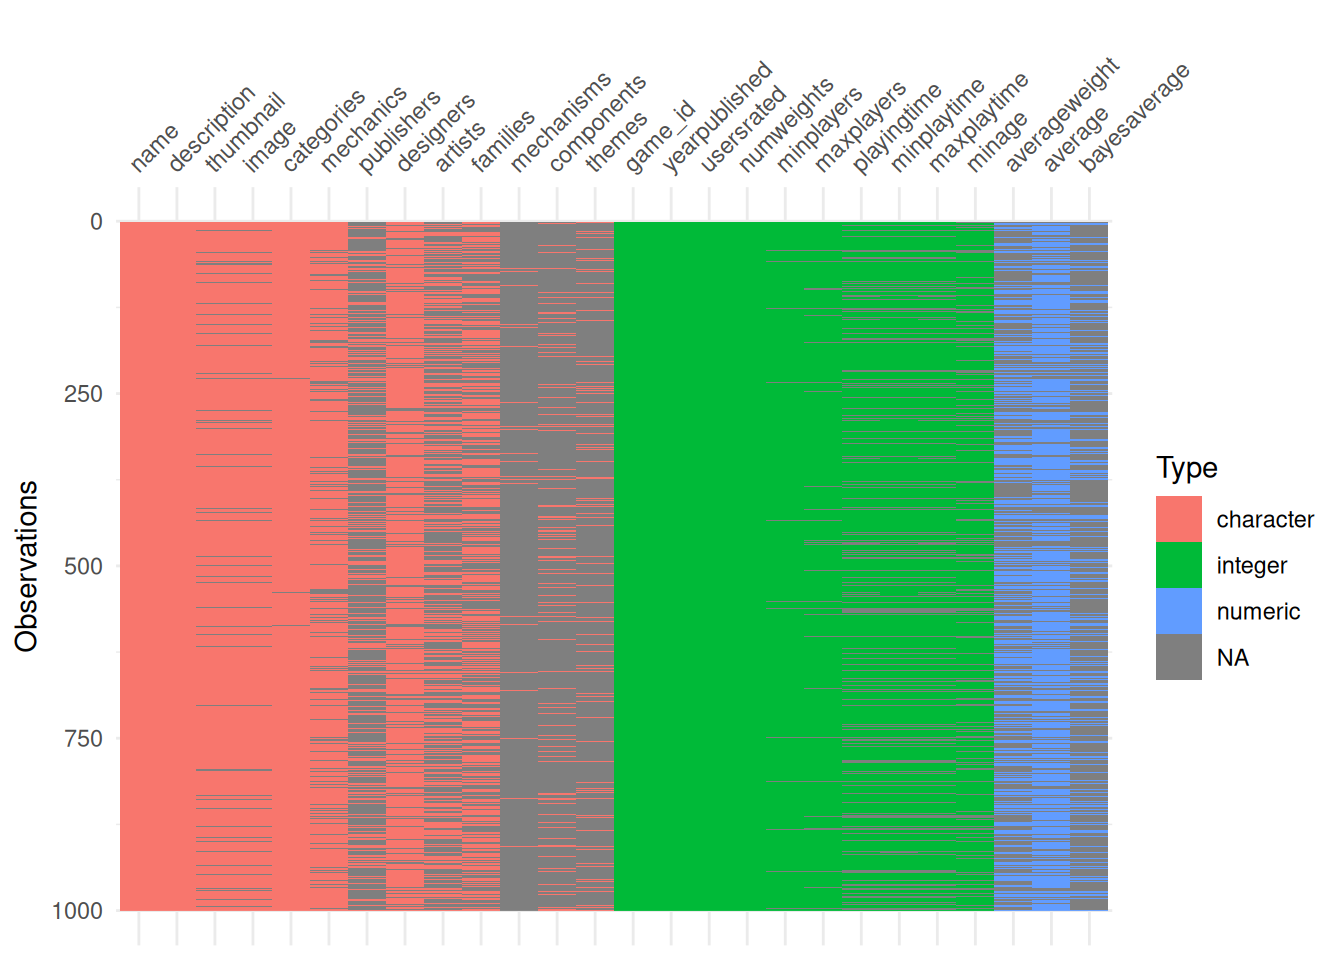
2.1 Outcomes
The data is at the game level, where I observe the BGG community’s aggregated ratings for individual games. This means I do not have data on the underlying ratings for games, only the average, standard deviation, or sum of the distribution.
I examine four different community outcomes for games: average weight rating (complexity), number of user ratings, average user rating, and geek rating. Only a subset of games have received enough votes by the BGG community to receive a geek rating, which is a bayesian average based on the number of ratings as well as the average rating.
Show the code
full_data |>
    filter_geek() |>
    log_ratings() |>
    plot_outcomes_distributions() +
    theme_set(theme_light() + theme(legend.position = 'top'))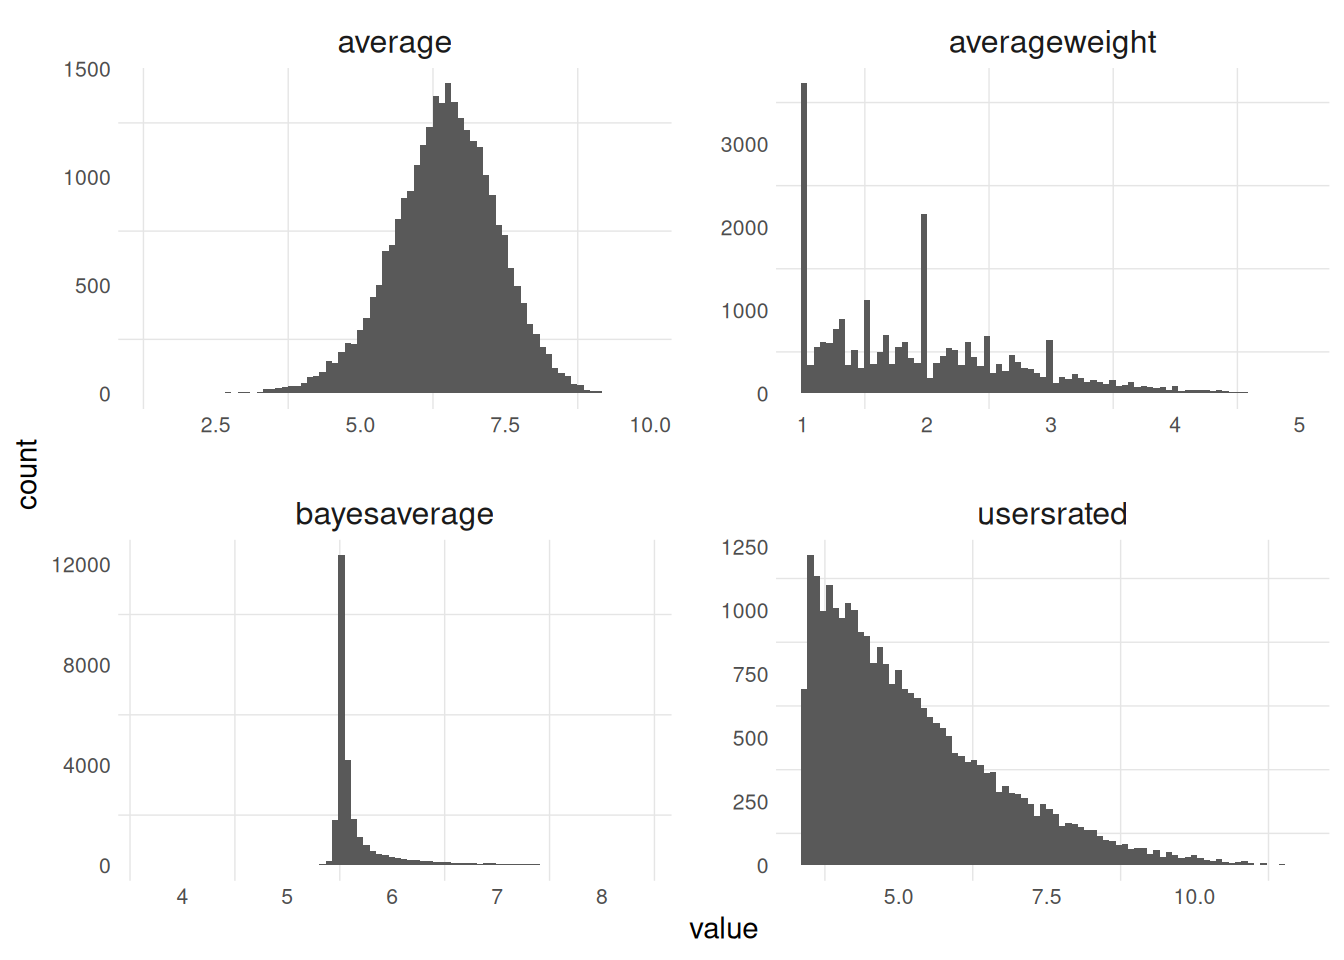
Each of these BGG outcomes (average weight, average, user ratings) is related to each other in some way, which is important to keep in mind as we think about modeling these outcomes.
The average weight tends to be highly correlated with the average rating, while not being correlated with the number of user ratings. The geek rating is a function of the average and user ratings, which means it is also then correlated with the average weight.
Show the code
full_data |>
    plot_outcomes_relationships() +
    theme_set(theme_light() + theme(legend.position = 'top'))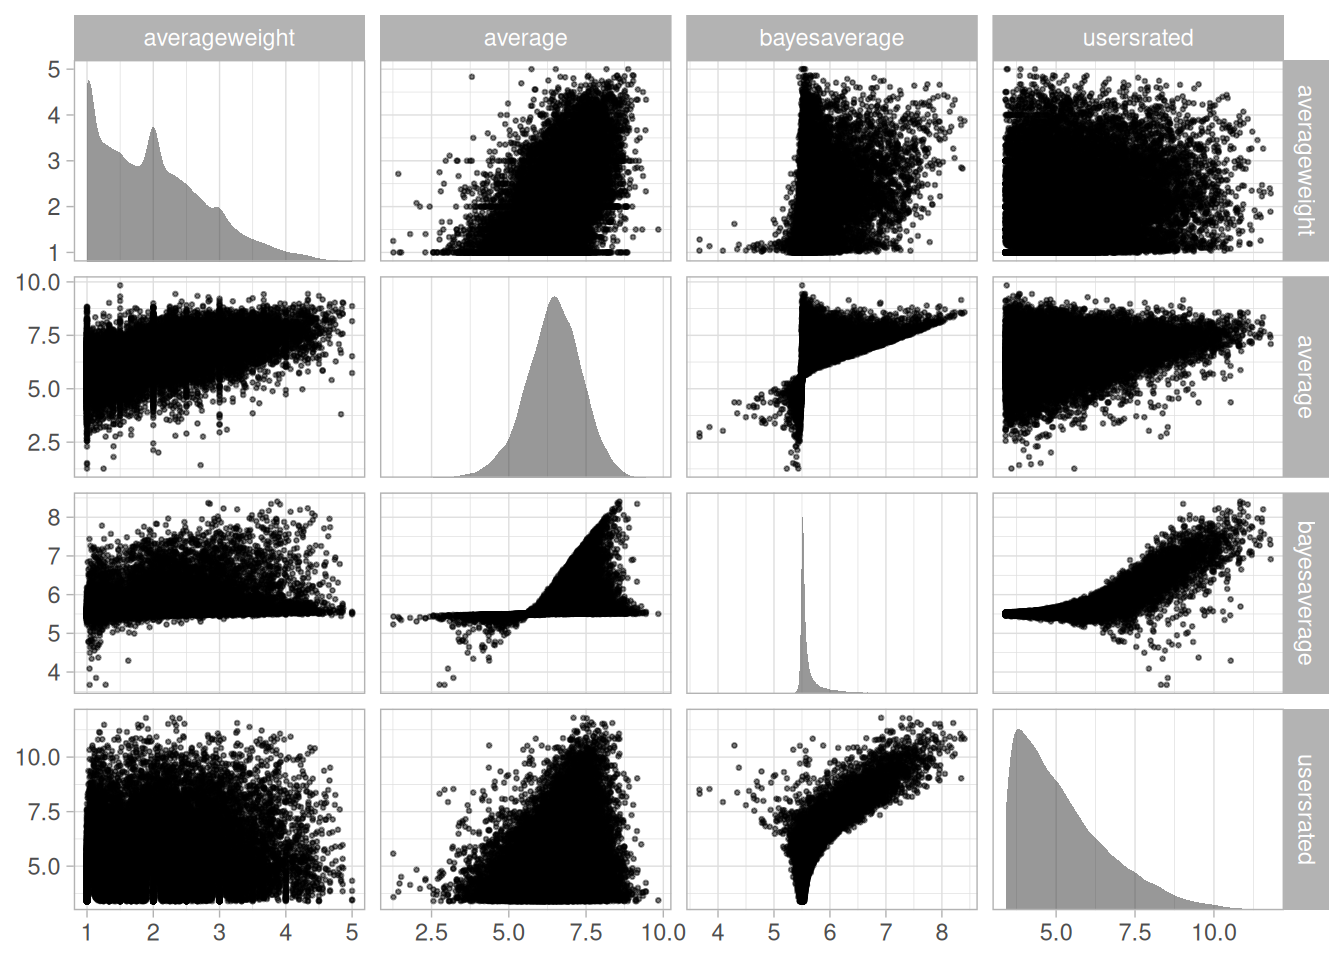
2.1.1 Number of Ratings
I train and evaluate the models primarily on games that have achieved at least 25 ratings, as this is the required number of user ratings for a game to receive a Geek rating.
The majority of games on BoardGameGeek do not actually receive this number of ratings, especially in recent years as the number of games published has dramatically increased. My main aim is to predict games that are set to be published and available to purchase, and many of the over 100k games on BGG have not been been published or distributed.
Ideally, I would have a variable that measures this directly, but I instead rely on achieving a minimum number of ratings as a heuristic.
Show the code
plot_games_by_split = function(data) {
    plot_data =
        data |>
        bggUtils:::unnest_outcomes() |>
        inner_join(
            data |>
                bggUtils:::unnest_info()
        ) |>
        add_hurdle() |>
        mutate(
            yearpublished = case_when(
                yearpublished < 1950 ~ 1949,
                TRUE ~ yearpublished
            )
        ) |>
        mutate(
            hurdle = case_when(
                hurdle == 'yes' ~ '>25 ratings',
                hurdle == 'no' ~ '<25 ratings'
            )
        ) |>
        group_by(yearpublished, hurdle) |>
        count()

    plot_data |>
        ggplot(aes(x = yearpublished, y = n, fill = hurdle)) +
        geom_col() +
        scale_color_manual(values = c("grey60", "navy"))
}

plot_games_by_split(games) +
    scale_fill_manual(values = c('coral', 'navy'))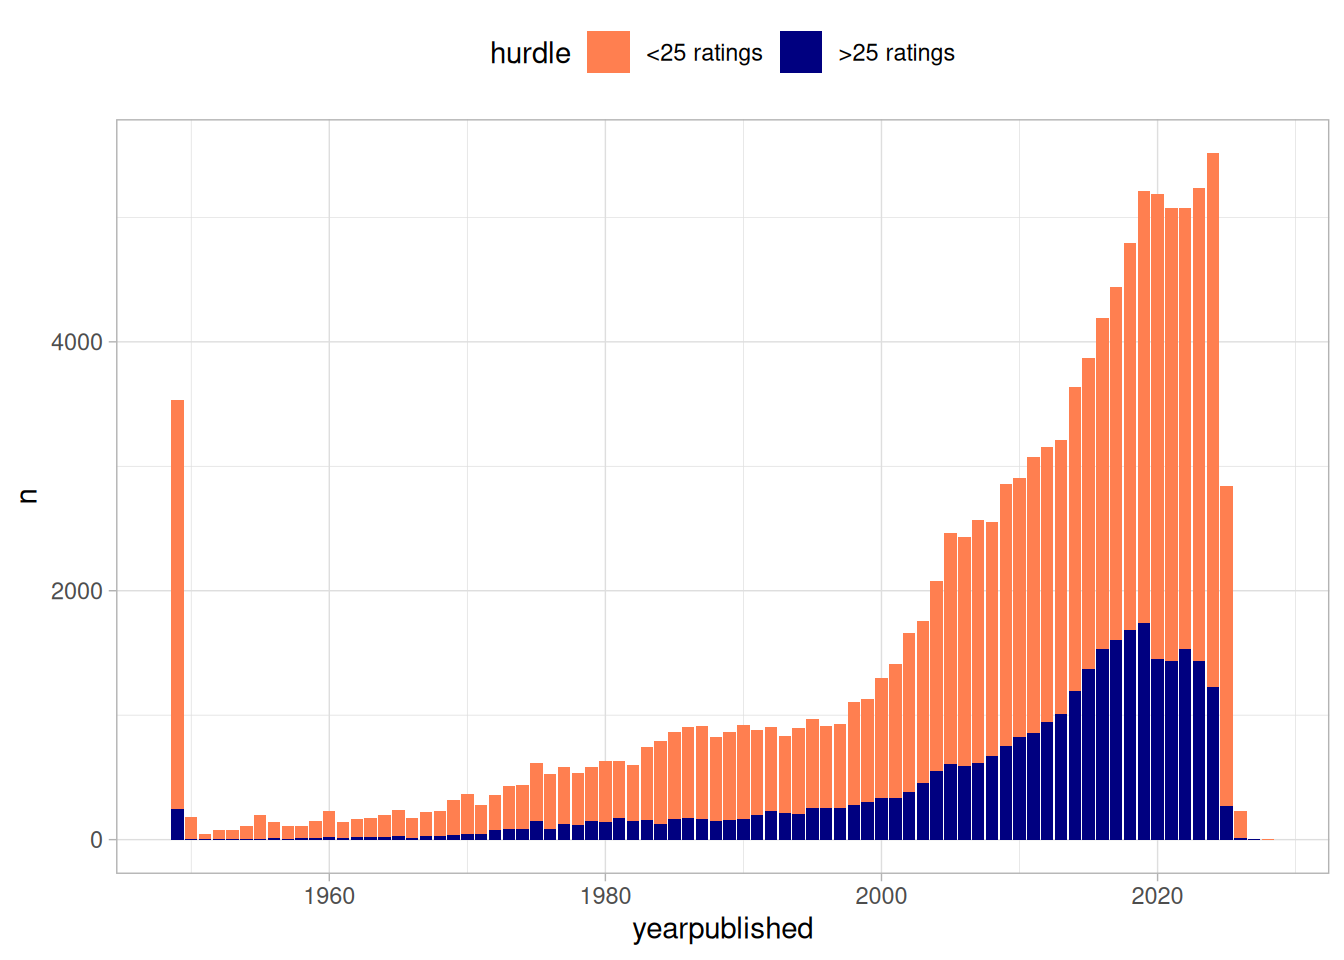
In predicting new games, I first use a hurdle model to predict whether games are expected to receive enough ratings to be assigned a Geek rating (25 ratings). This model is trained on the full universe of games, whereas the others are trained on games with at least 25 ratings.
The model for predicting the average weight is trained on games that have received 25 ratings and have also received at least 5 votes on their complexity.
Show the code
bind_rows(
    as_tibble(hurdle_fit$metadata$user$data) |>
        group_by(model = 'hurdle') |>
        count(),
    as_tibble(average_fit$metadata$user$data) |>
        group_by(model = 'average') |>
        count(),
    as_tibble(averageweight_fit$metadata$user$data) |>
        group_by(model = 'averageweight') |>
        count(),
    as_tibble(usersrated_fit$metadata$user$data) |>
        group_by(model = 'usersrated') |>
        count()
) |>
    ungroup() |>
    rename(games = n) |>
    arrange(desc(games)) |>
gt::gt()| model | games |
|---|---|
| hurdle | 103528 |
| average | 27812 |
| usersrated | 27812 |
| averageweight | 17315 |
2.2 Assessment
How did the models perform in predicting games? I evaluated the model on games published in 2022 and 2023.
Show the code
valid_predictions |>
    group_by(yearpublished) |>
    count() |>
    ungroup() |>
gt::gt()| yearpublished | n |
|---|---|
| 2022 | 5053 |
| 2023 | 5205 |
2.2.1 Hurdle
I first used the hurdle model to classify whether games would receive at least 25 ratings.
I set the probability threshold at 0.16 - this was the point that maximized the F2 score and minimized false negatives. For the purpose of the hurdle model, including a game that did not receive a Geek rating is much worse than missing a game that did. The main purpose of the model is filter out low-quality games.
Show the code
valid_predictions |>
    ggplot(aes(x = .pred_hurdle_yes, fill = hurdle)) +
    geom_density(alpha = 0.5) +
    scale_color_manual() +
    theme(legend.title = element_text()) +
    xlab("Pr(User Ratings >= 25)") +
    scale_fill_manual(values = c("coral", "navy")) +
    guides(fill = guide_legend(title = 'User Ratings >=25')) +
    geom_vline(xintercept = hurdle_threshold, linetype = 'dashed')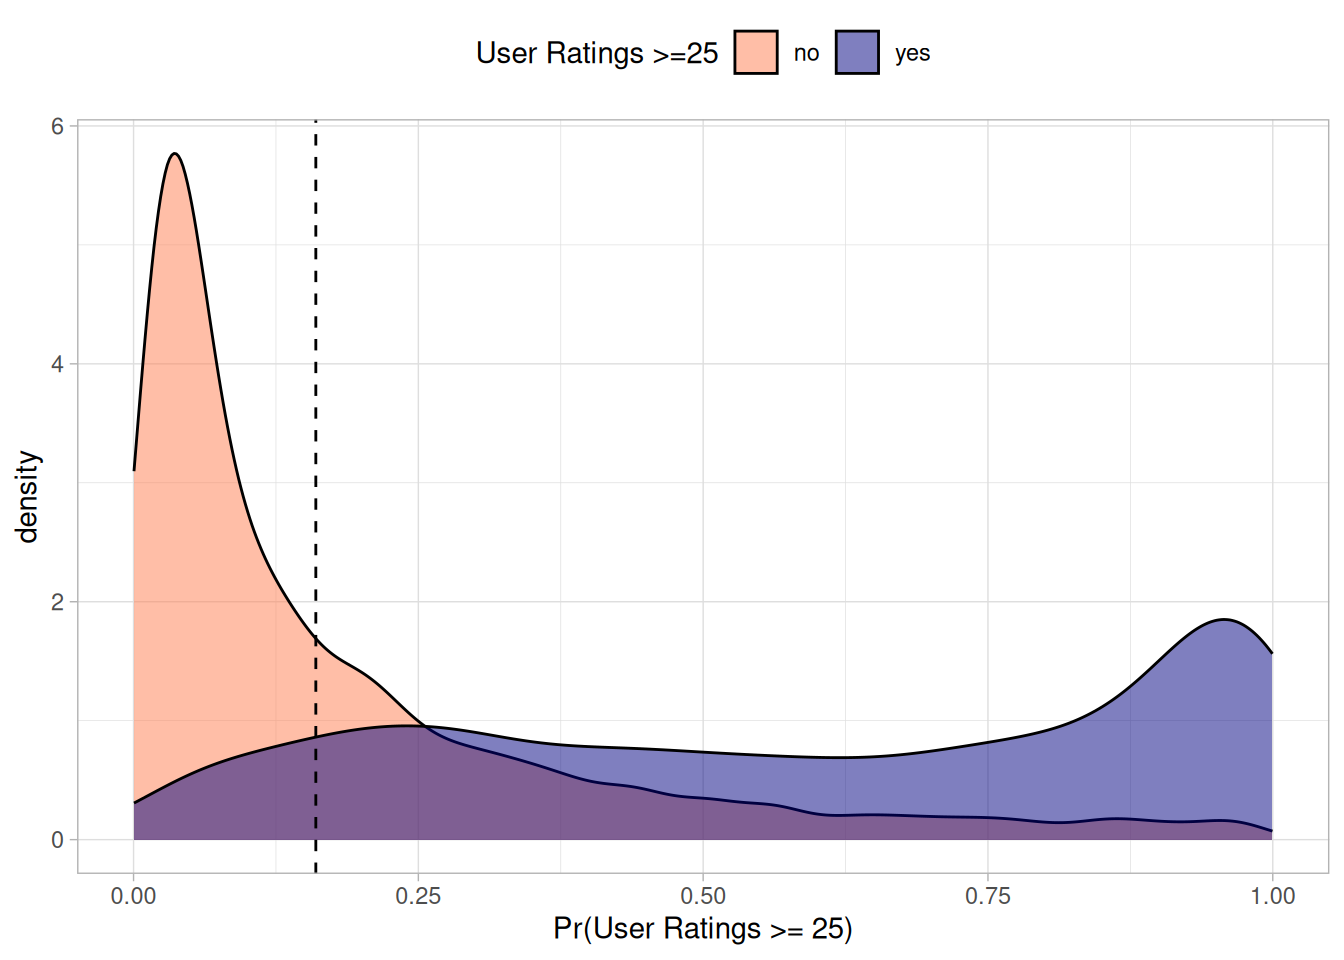
Show the code
prob_metrics = metric_set(yardstick::roc_auc, yardstick::pr_auc)

prob_hurdle_metrics =
    valid_predictions |>
    group_by(outcome = 'hurdle') |>
    prob_metrics(truth = hurdle, .pred_hurdle_yes, event_level = 'second')

valid_hurdle_metrics |>
    bind_rows(prob_hurdle_metrics) |>
    gt::gt() |>
    gt::tab_options(quarto.disable_processing = T) |>
    gt::fmt_number(columns = c(".estimate"), decimals = 3) |>
gtExtras::gt_theme_espn()| outcome | .metric | .estimator | .estimate |
|---|---|---|---|
| hurdle | bal_accuracy | binary | 0.763 |
| hurdle | kap | binary | 0.424 |
| hurdle | mcc | binary | 0.476 |
| hurdle | f1_meas | binary | 0.636 |
| hurdle | f2_meas | binary | 0.768 |
| hurdle | precision | binary | 0.494 |
| hurdle | recall | binary | 0.891 |
| hurdle | j_index | binary | 0.526 |
| hurdle | roc_auc | binary | 0.861 |
| hurdle | pr_auc | binary | 0.737 |
Show the code
valid_predictions |>
    conf_mat(hurdle, .pred_hurdle_class) |>
    autoplot(type = 'heatmap')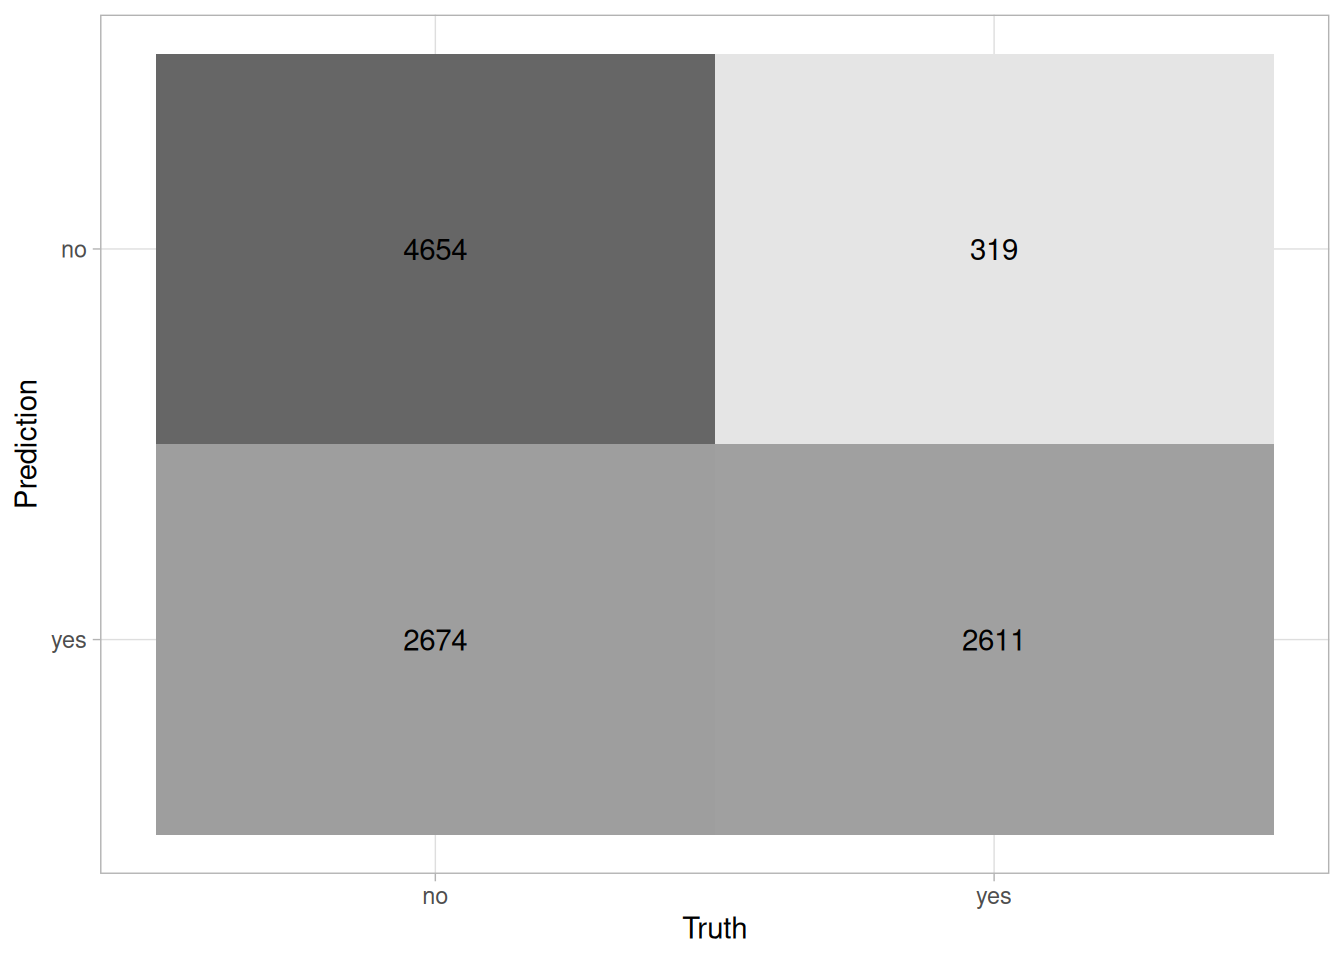
Which games that the model classified as “no” received 25+ ratings?
Show the code
valid_predictions |>
    filter(.pred_hurdle_class == 'no') |>
    filter(usersrated >= 25) |>
    select(yearpublished, game_id, name, usersrated, bayesaverage) |>
    arrange(desc(usersrated)) |>
    mutate(bayesaverage = round(bayesaverage, 3)) |>
    mutate(across(all_of(c("yearpublished", "game_id")), ~ as.factor(.x))) |>
    DT::datatable()
Which games that the model classified as “yes” did not receive 25+ ratings?
Show the code
valid_predictions |>
    filter(.pred_hurdle_class == 'yes') |>
    filter(usersrated < 25) |>
    select(yearpublished, game_id, name, usersrated, .pred_bayesaverage) |>
    arrange(desc(usersrated)) |>
    mutate(.pred_bayesaverage = round(.pred_bayesaverage, 3)) |>
    mutate(across(all_of(c("yearpublished", "game_id")), ~ as.factor(.x))) |>
    DT::datatable()
2.2.2 Ratings
I evaluate predictions for the average weight rating, the average rating, the number of user ratings, and the Geek rating.
Show the code
plot_hurdle_yes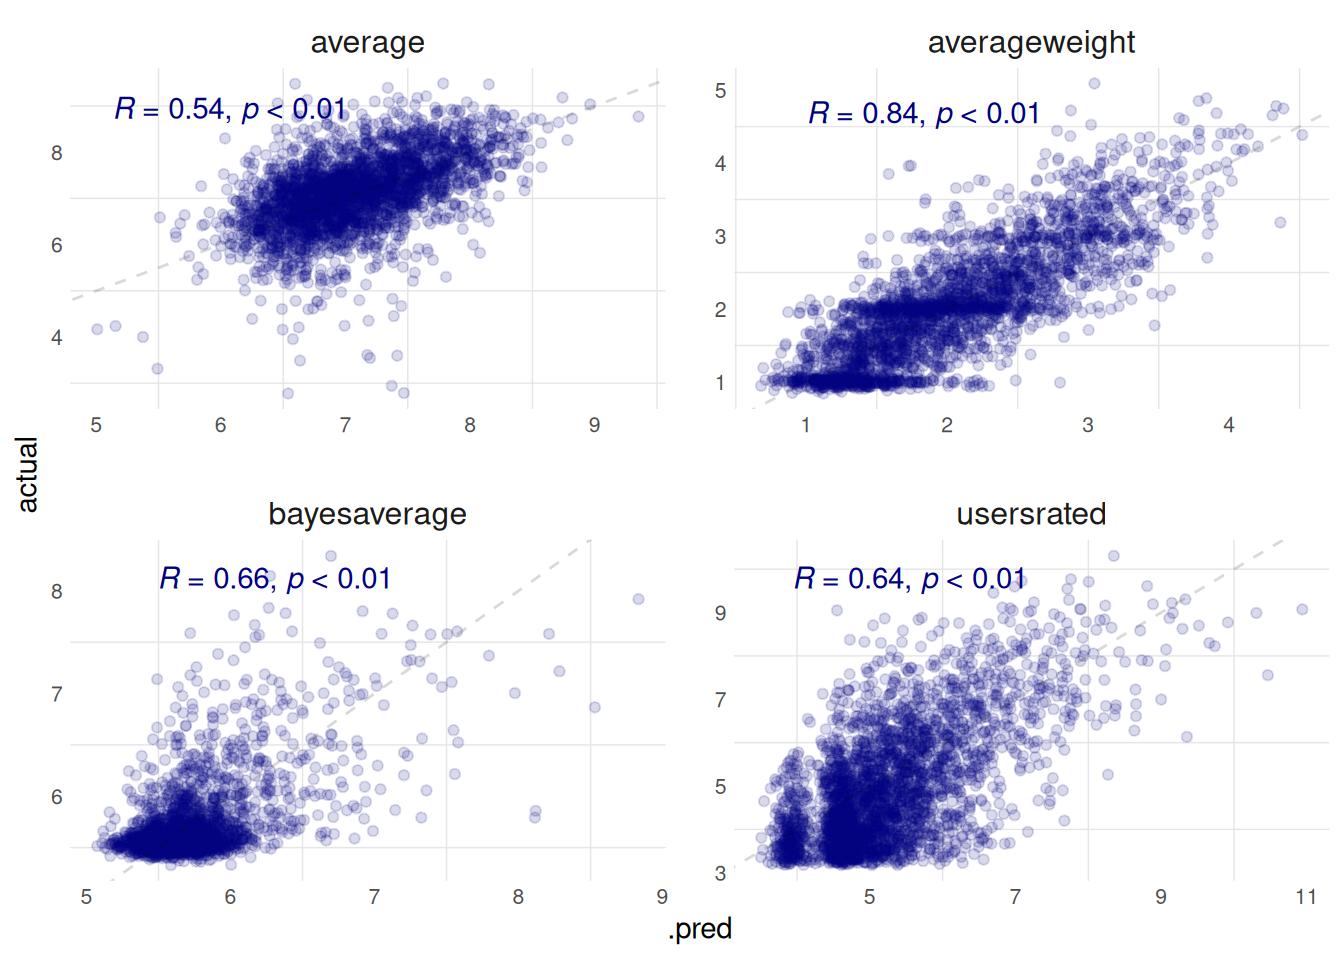
Show the code
plot_hurdle_no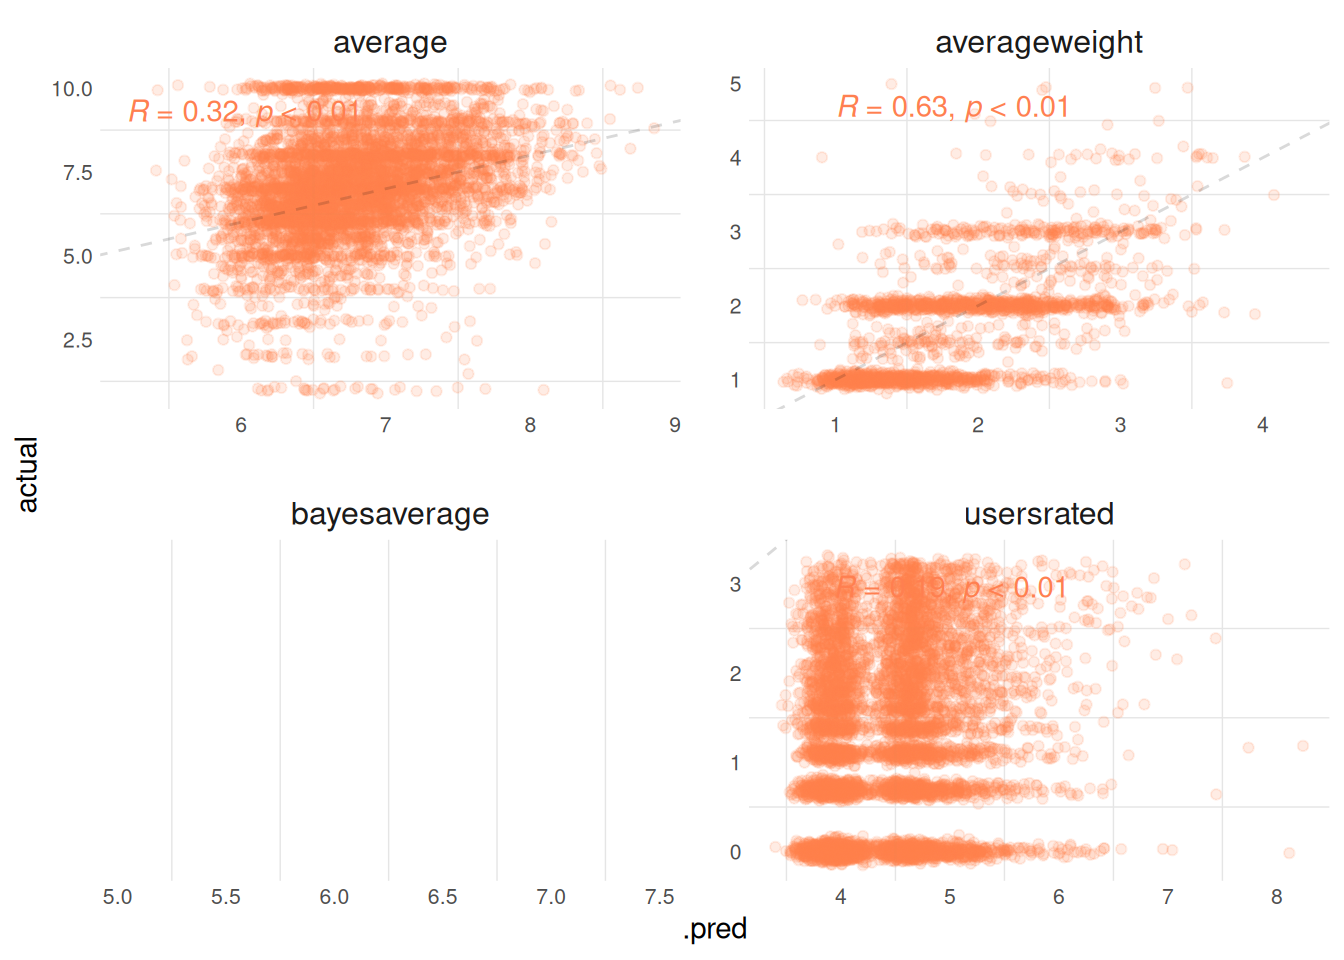
Show the code
targets_tracking_details(metrics = valid_metrics, details = details) |>
    select(
        model,
        minratings,
        outcome,
        any_of(c("rmse", "mae", "mape", "rsq", "ccc"))
    ) |>
    filter(minratings == 25) |>
    select(minratings, everything()) |>
    gt::gt() |>
    gt::tab_options(quarto.disable_processing = T) |>
gtExtras::gt_theme_espn()| minratings | model | outcome | rmse | mae | mape | rsq | ccc |
|---|---|---|---|---|---|---|---|
| 25 | glmnet | average | 0.675 | 0.498 | 7.374 | 0.294 | 0.487 |
| 25 | lightgbm | averageweight | 0.437 | 0.336 | 18.019 | 0.706 | 0.827 |
| 25 | glmnet+glmnet | bayesaverage | 0.285 | 0.159 | 2.647 | 0.430 | 0.649 |
| 25 | glmnet | usersrated | 1941.387 | 446.031 | 154.763 | 0.122 | 0.335 |
What were the model’s top predictions in the validation set?
Show the code
valid_predictions |>
filter(.pred_hurdle_class == 'yes') |>
select(-starts_with(".pred_hurdle")) |>
slice_max(.pred_bayesaverage, n = 150, with_ties = F) |>
predictions_dt(
games = games,
lazy_load = TRUE,
pageLength = 10
) |>
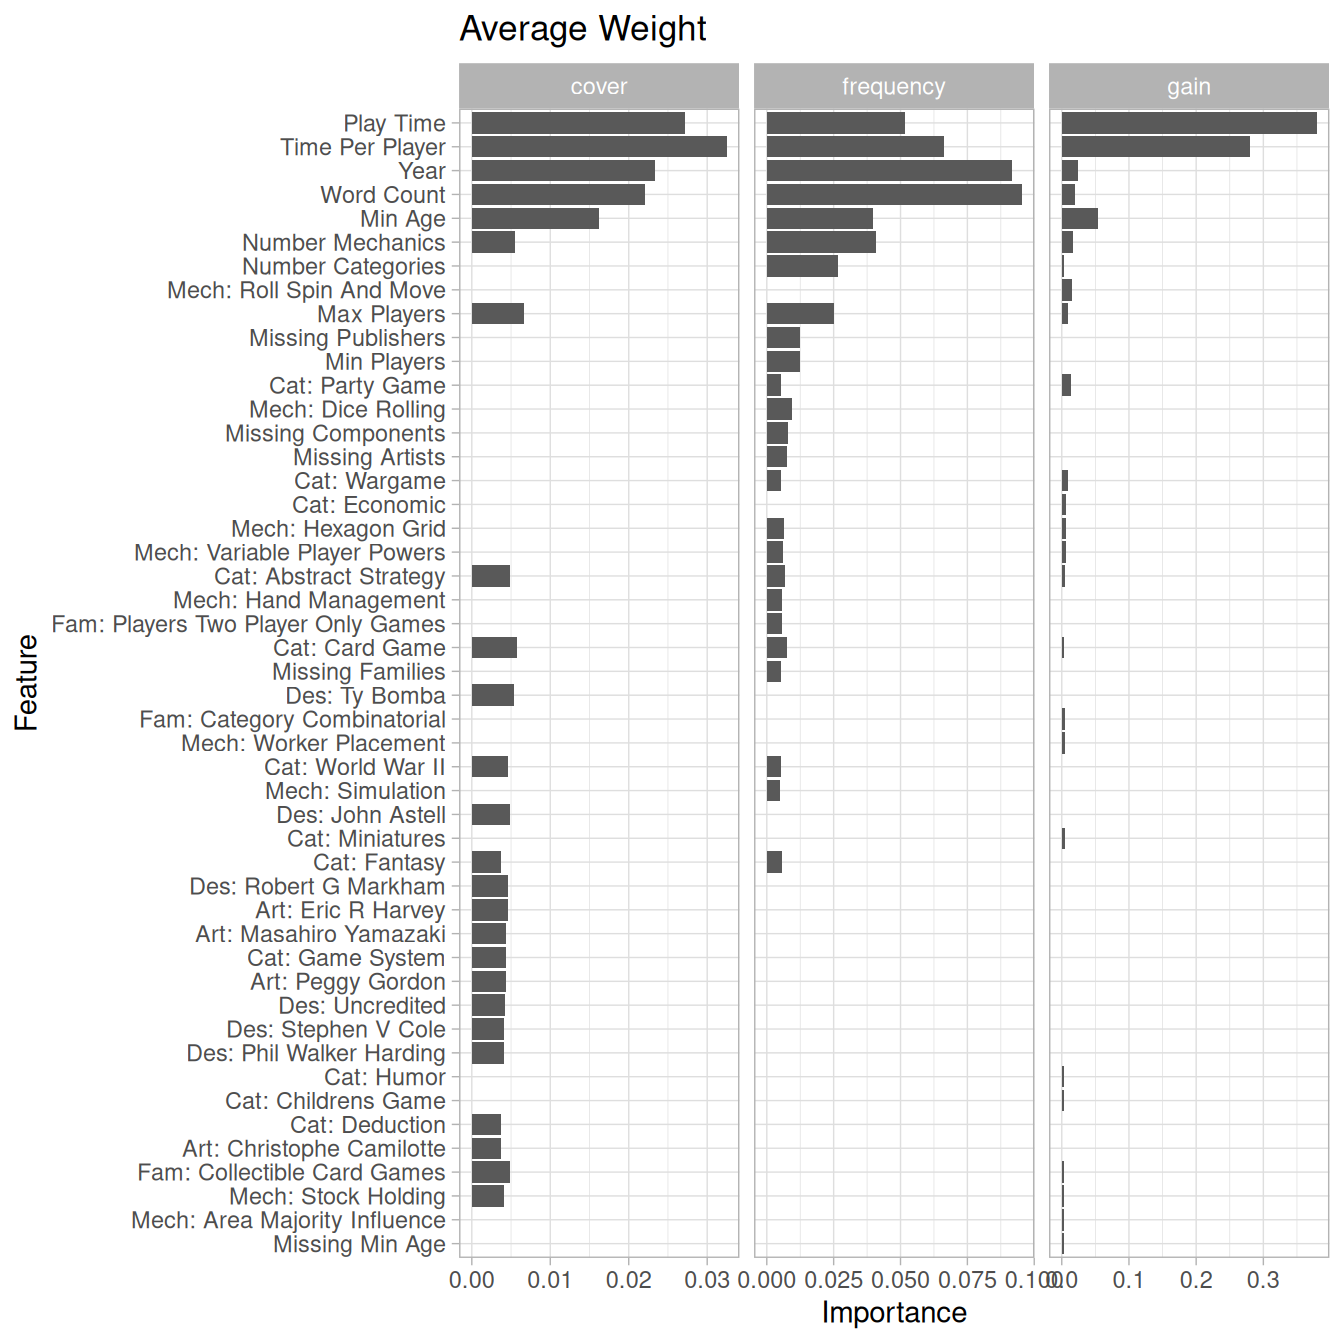
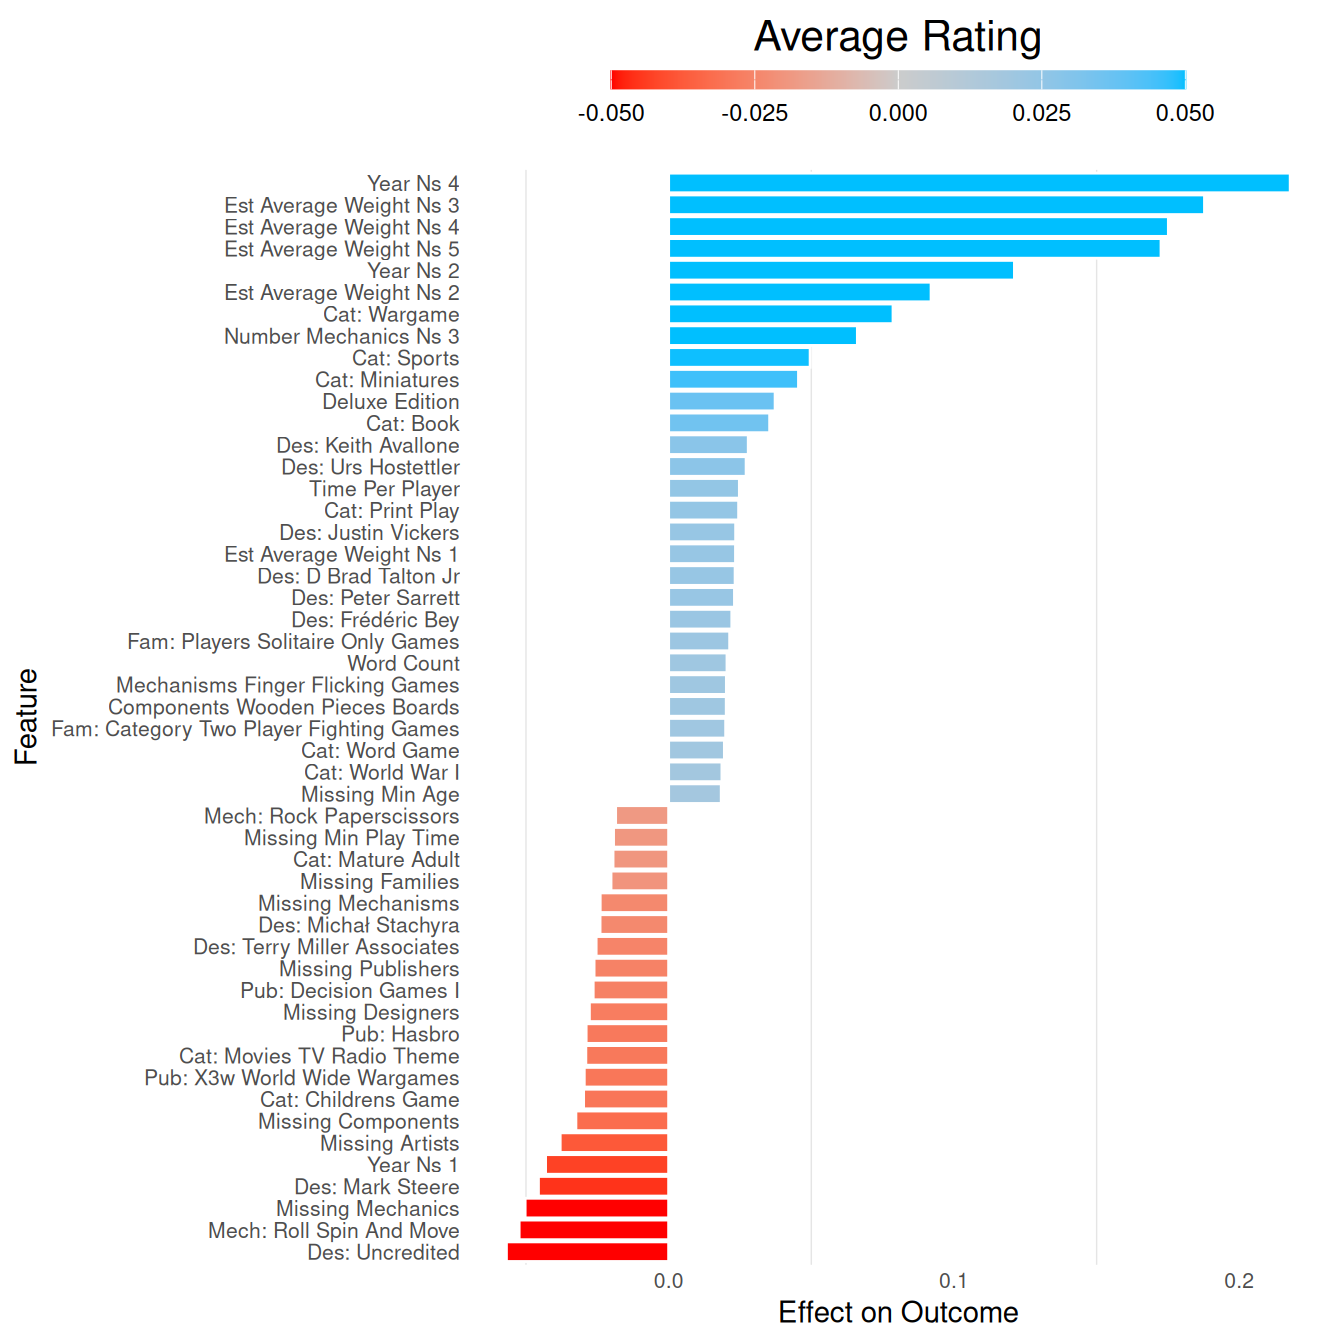
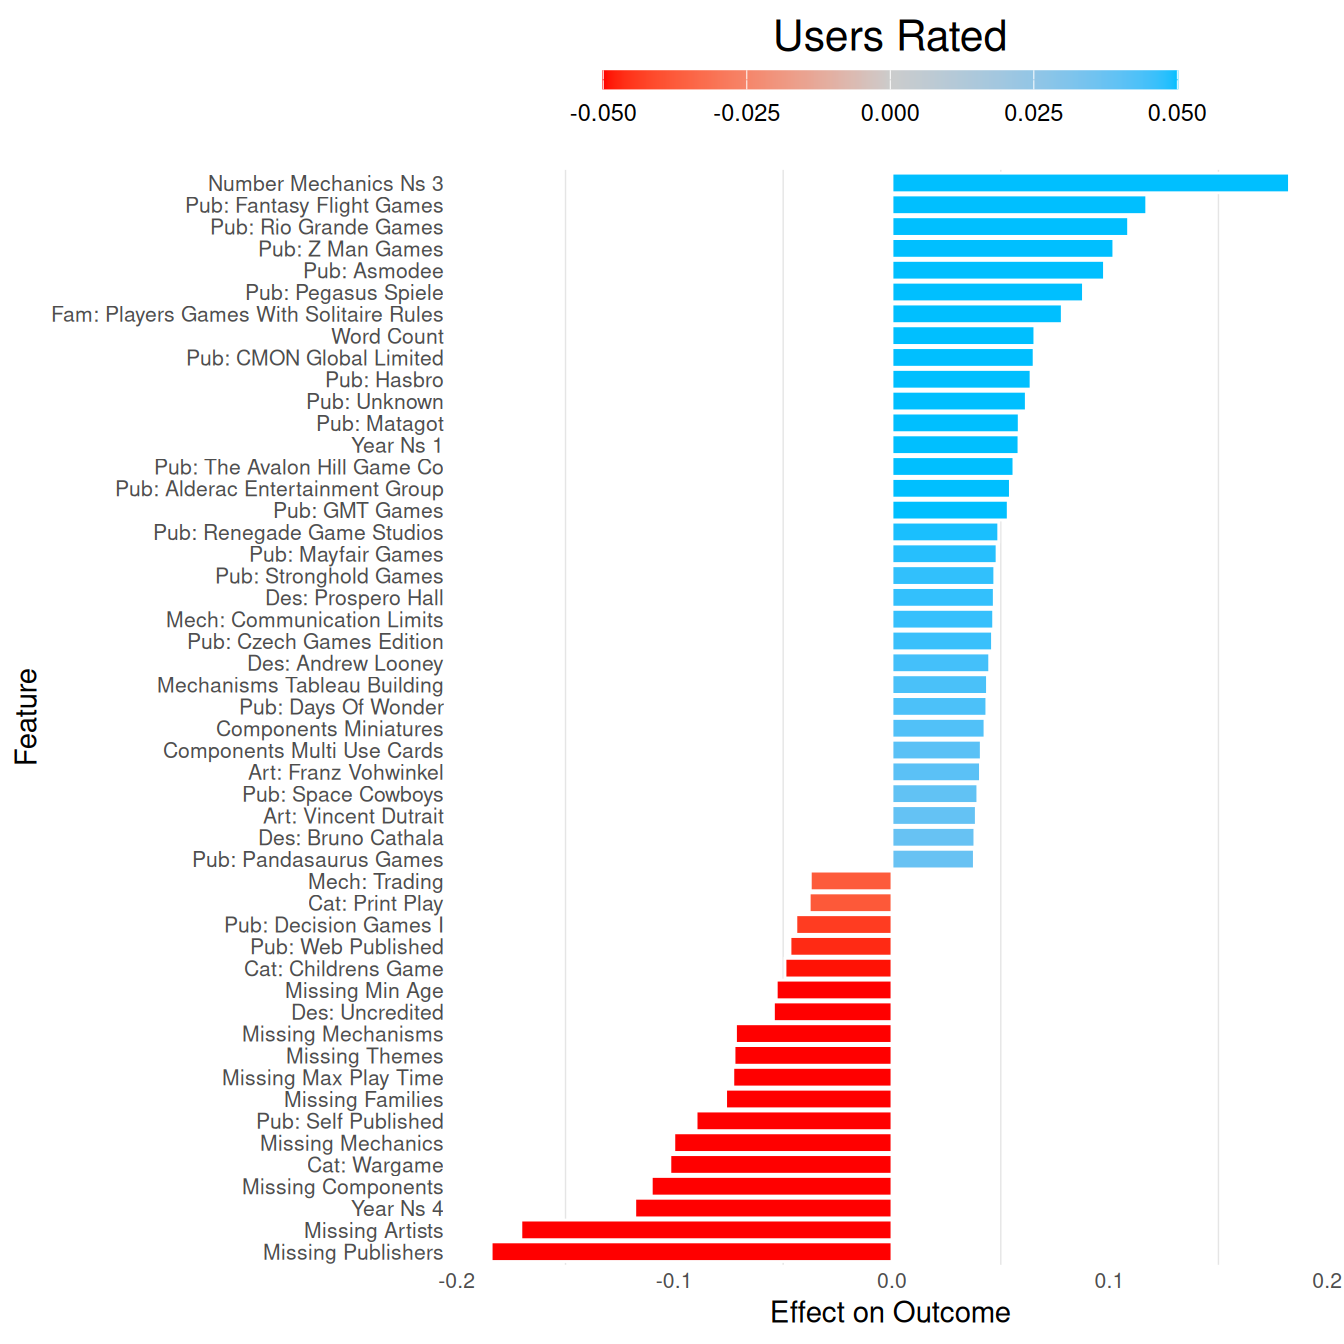
add_colors()2.3 Features
Which features were influential for predicting each BGG outcome?
Show the code
average_plot =
    average_fit |>
    extract_vetiver_features() |>
    plot_model_features() +
    labs(title = 'Average Rating')

averageweight_plot =
    averageweight_fit |>
    extract_vetiver_features() |>
    plot_model_features() +
    labs(title = 'Average Weight')

usersrated_plot =
    usersrated_fit |>
    extract_vetiver_features() |>
    plot_model_features() +
    labs(title = 'Users Rated')